• Manual reports take too much time
• Difficult to analyse defect trends
• No clear view of machine-wise rejection
• Excel data scattered across sheets
A Simple, Ready-to-Use Solution
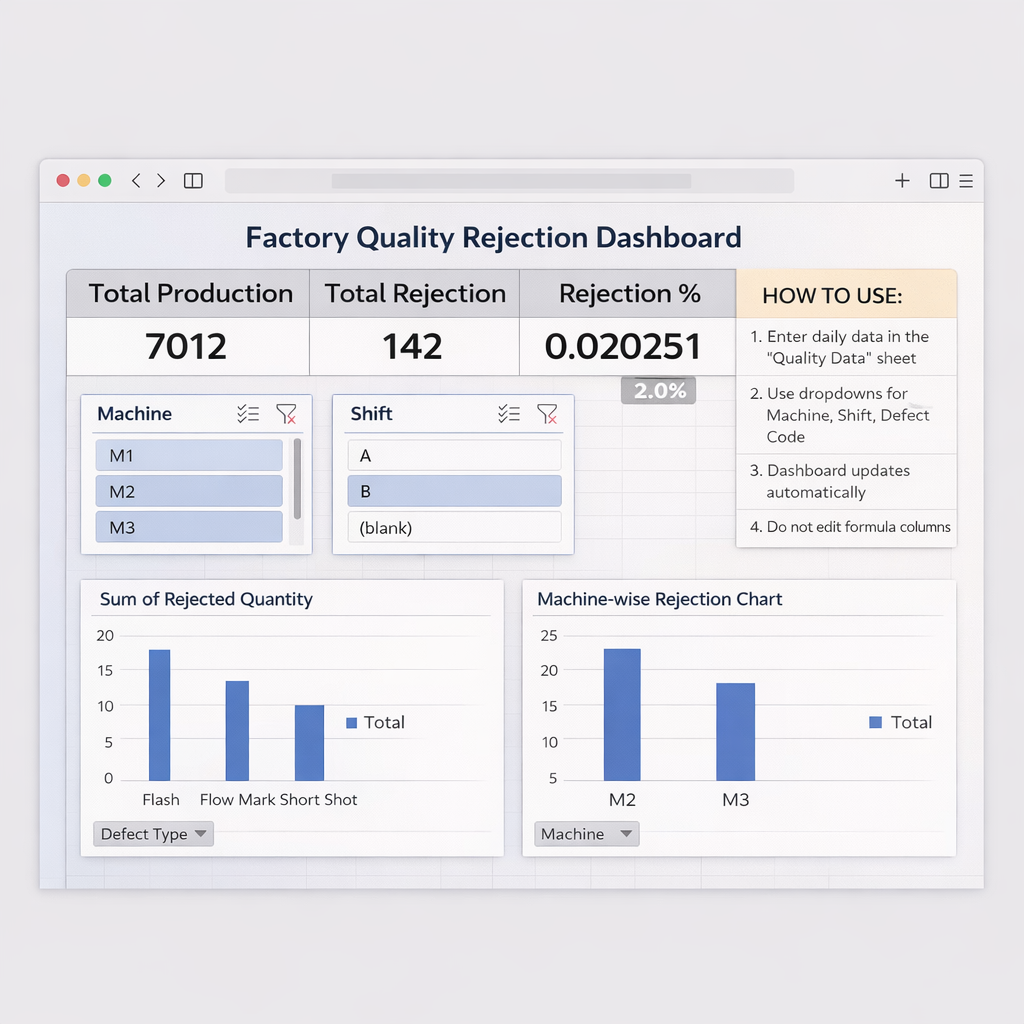
This Excel dashboard automatically converts daily production data into clear charts and KPIs.
No complex setup. No advanced Excel skills required.
What You Get
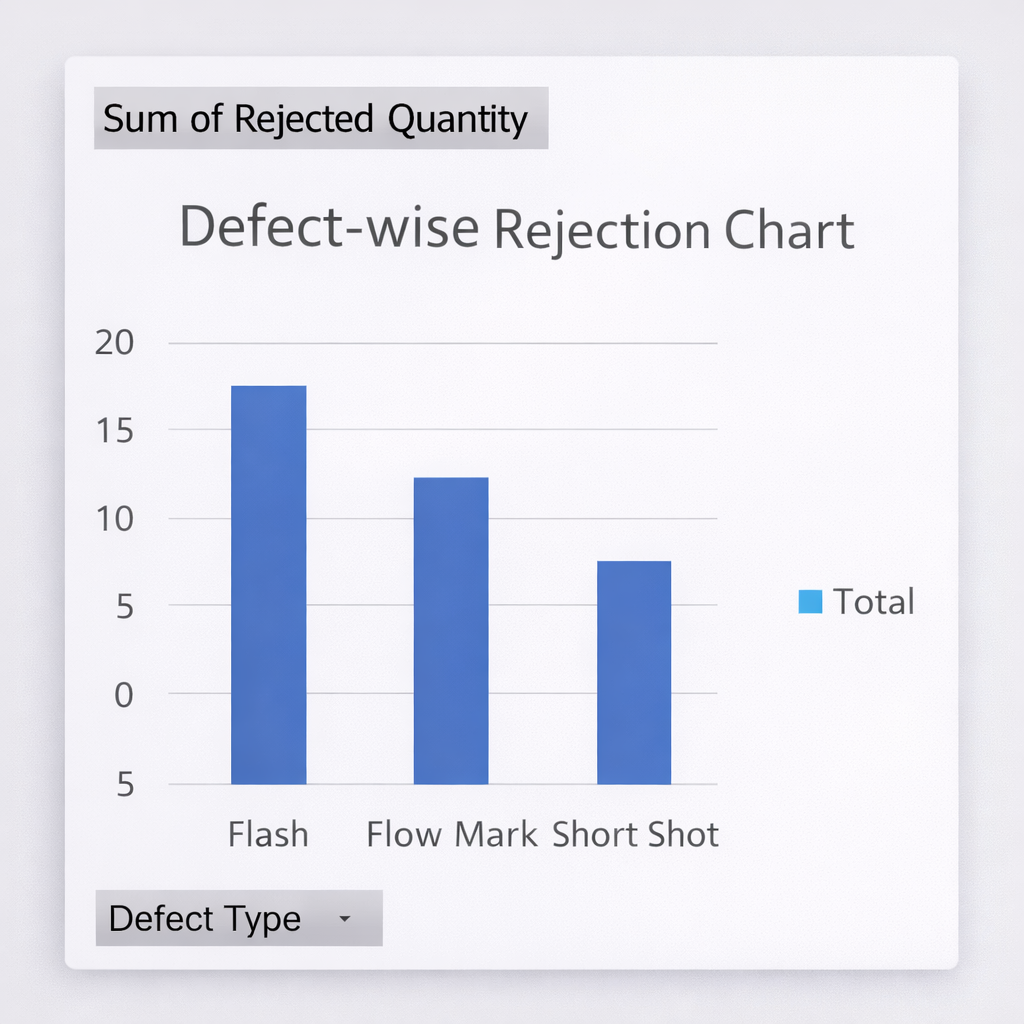
✔ Defect-wise rejection analysis
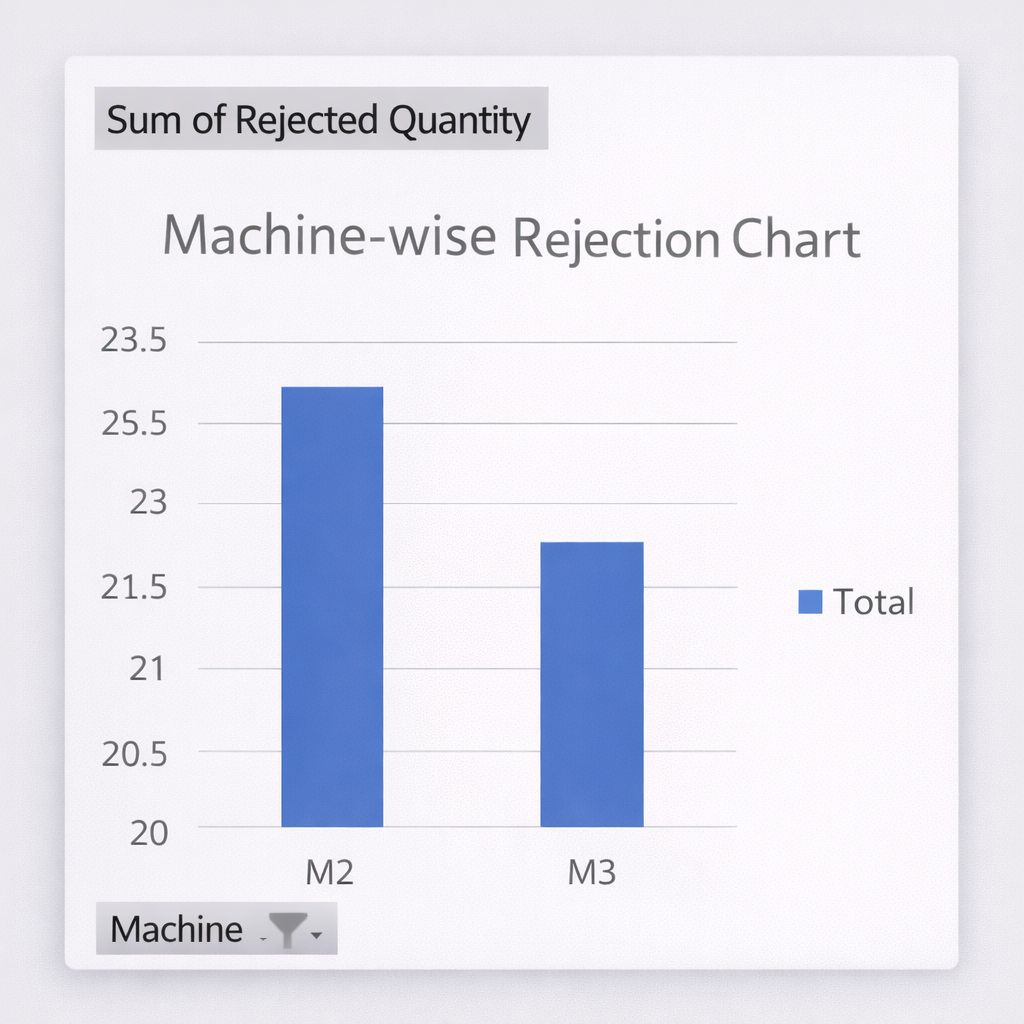
✔ Machine-wise rejection analysis
✔ Automatic KPI calculation
✔ Interactive filters (Machine, Shift)
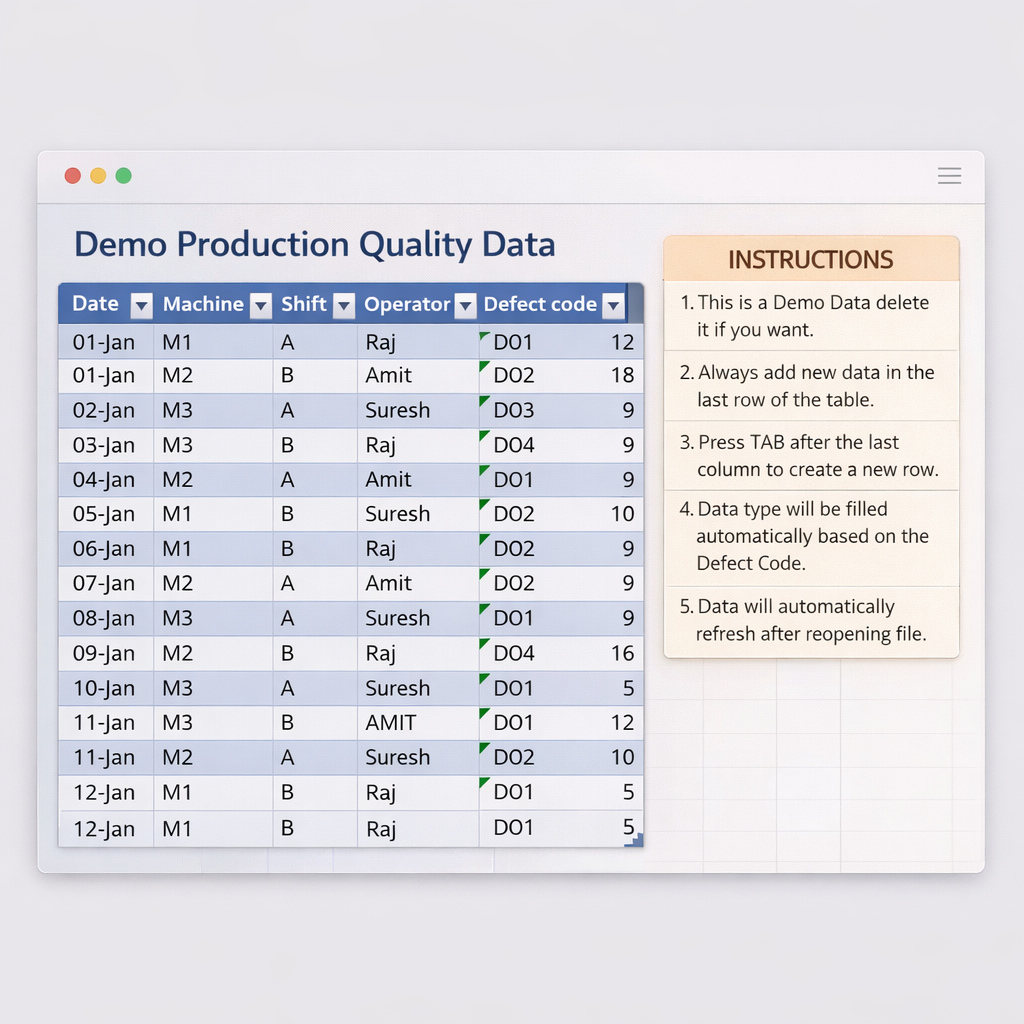
✔ Easy data entry sheet
✔ Instant download after purchase
Who Is This Dashboard For?
✔ Injection moulding units
✔ Manufacturing factories
✔ Quality engineers
✔ Production & plant managers
✔ Small and mid-size industries
How It Works
Download the Excel File
After successful payment, instantly download the Excel quality dashboard file.
Enter Your Production Data
Enter daily production and rejection data in the input sheet using simple dropdowns.
View Live Dashboard Insights
Defect-wise and machine-wise charts update automatically without manual work.
No advance Excel skills required. Works with Excel 2016 and above.
Simple One-Time Pricing
No subscription. No hidden charges. Lifetime access.